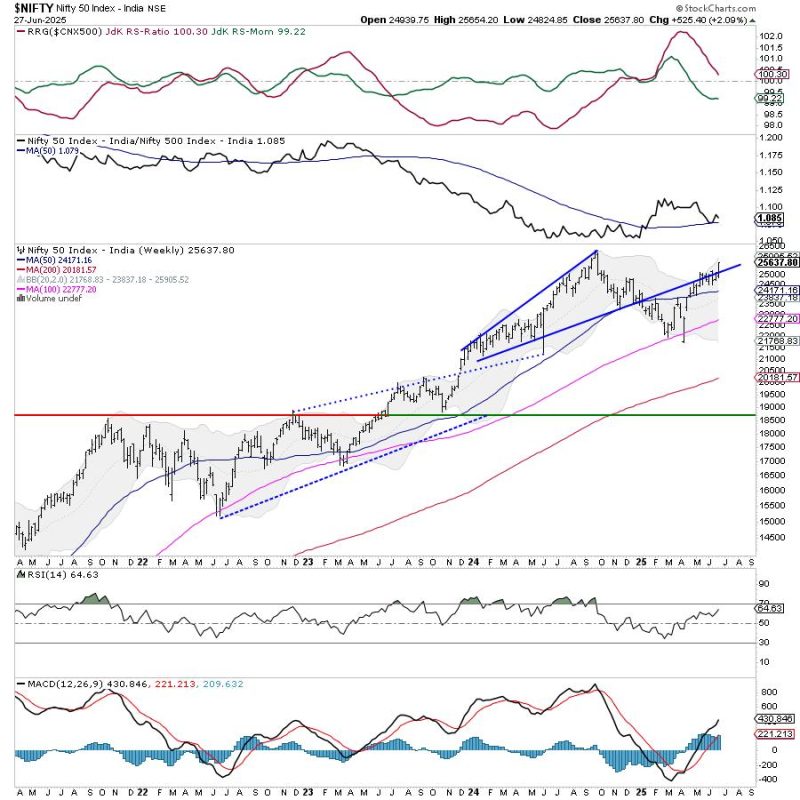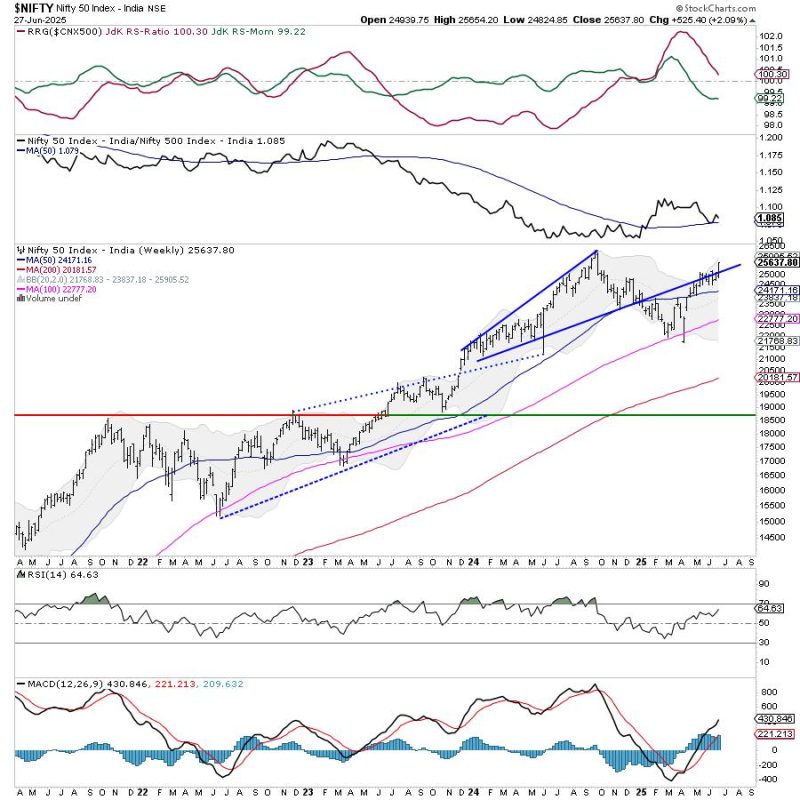
After six weeks of consolidation and trading in a defined range, the markets finally broke out from this formation and ended the week with gains. Over the past five sessions, the markets have largely traded with a positive undercurrent, continuing to edge higher. The trading range was wider than anticipated; the Nifty traded in an 829-point range over the past few days. Volatility took a backseat; the India Vix slumped by 9.40% to 12.39 on a weekly basis. While trending higher throughout the week, the headline index closed with a net weekly gain of 525.40 points (2.09%).
The breakout that occurred in the previous week has pushed the support level higher for the Index. Now, the most immediate support level has been dragged higher to the 25100-25150 zone, the one that the markets penetrated to move higher. So long as the Nifty keeps its head above this zone, it is likely to continue moving higher. Over the coming weeks, we are also likely to see a distinct shift in the leadership, with the sectors that were in the bottoming-out process taking the lead. This would also mean that one must now focus on taking profits in the spaces that have run up much harder over the past week. While protecting gains, it would be wise to shift focus to the sectors that are likely to see much improved relative strength going forward from here.
The levels of 25750 and 26000 are likely to act as potential resistance levels for the coming week. The supports come in at the 25,300 and 25,000 levels. The trading range is likely to stay wider than usual.
The weekly RSI is 64.58; it stays neutral and does not show any divergence against the price. The weekly MACD is bullish and remains above its signal line. A large white candle emerged, indicating the directional strength that the markets exhibited throughout the week.
The pattern analysis of the weekly chart shows that the Nifty initially crossed above the rising trendline pattern resistance. This trendline began from the low of 21150 and joined the subsequent rising bottoms. However, the Nifty consolidated above the breakout point for six weeks before finally resuming its move higher. The Index has pushed its resistance levels higher; as long as the Index stays above the 25000 level, this breakout will remain valid.
It is also important to note that the Nifty’s Relative Strength (RS) line is attempting to reverse its trajectory. This may lead to the frontline index improving its relative performance against the broader markets. Along with this shift in relative strength, it is also strongly recommended that one consider protecting gains in sectors that have risen significantly over the past several weeks. The leadership over the coming weeks is likely to change, making rotating sectors even more important than before. While protecting gains, new purchases must be initiated in sectors that are showing improvement in momentum and relative strength. While some consolidation cannot be ruled out, a positive outlook is suggested for the coming week.
Sector Analysis for the coming week
In our look at Relative Rotation Graphs®, we compared various sectors against the CNX500 (NIFTY 500 Index), representing over 95% of the free-float market cap of all the listed stocks.

Relative Rotation Graphs (RRG) show that only two sector Indices, Nifty Midcap 100 and the Nifty PSU Bank Index, are inside the leading quadrant. While the Midcap Index continues to rotate strongly, the PSU Bank Index is seen giving up on its relative momentum. These two groups are likely to outperform the broader markets relatively.
The Nifty PSE Index has rolled inside the weakening quadrant. This may result in the sector slowing down on its relative performance. The Nifty Commodities, Financial Services, Infrastructure, Banknifty, and the Services Sector Index are also inside the weakening quadrant.
The Nifty Consumption Index has rolled into the lagging quadrant. The FMCG Index and the Pharma Index also continue to languish inside this quadrant. The Nifty Metal Index is also located within the lagging quadrant; however, it is sharply improving its relative momentum compared to the broader markets.
The Nifty Realty, Media, IT, Auto, and Energy Indices are located within the leading quadrant. These groups are likely to assume leadership over the coming weeks as they continue to improve their relative momentum and strength compared to the broader Nifty 500 Index.
Important Note: RRG charts show the relative strength and momentum of a group of stocks. In the above Chart, they show relative performance against NIFTY500 Index (Broader Markets) and should not be used directly as buy or sell signals.
Milan Vaishnav, CMT, MSTA
Consulting Technical Analyst

